Download WSO's free Charts & Figures powerpoint template below! This template allows you to showcase some of your financial numbers in graphics and figures format. The template is plug-and-play, and you can enter your own text or numbers. The template also includes other slide pages for other elements of a financial model presentation. According to theWSODictionary,
"Charts, figures, and graphics are typically used to present raw data, not when you want to show a relationship between variables."
A screenshot below shows a sneak peak of the template.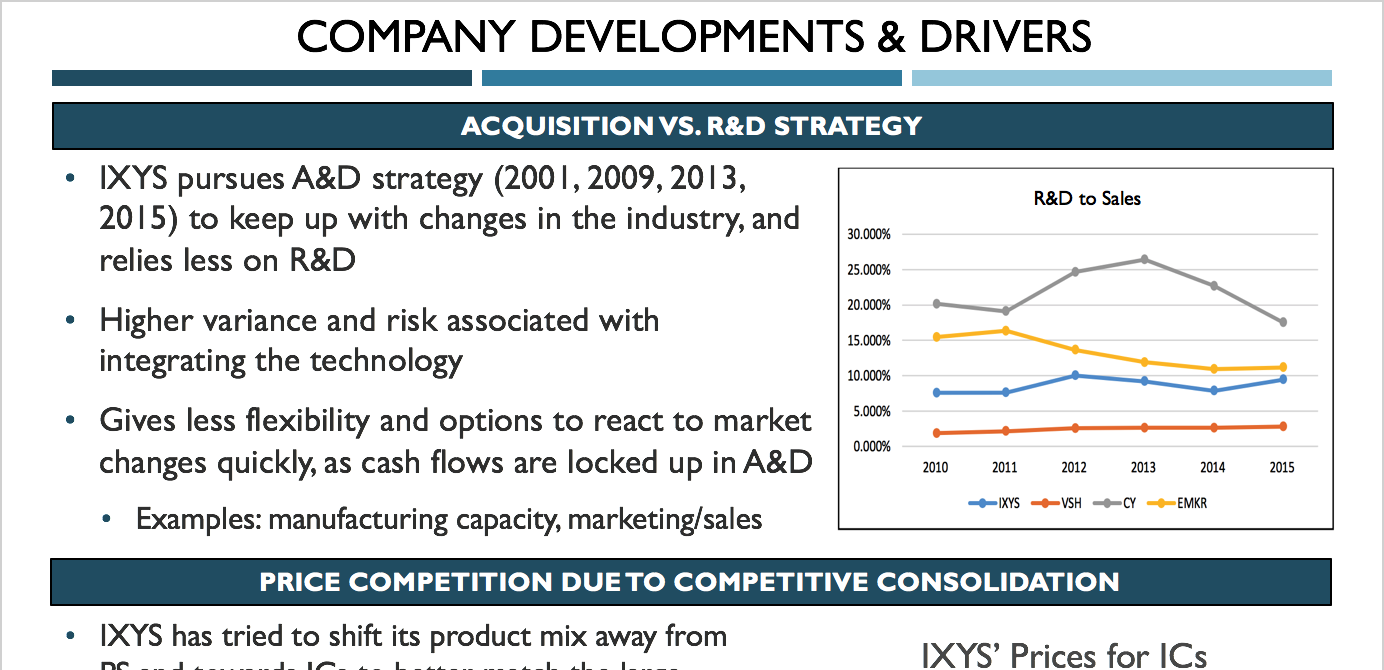


or Want toSign upwith your social account?